
 Latest software enables you to actually see where people are looking during a presentation.
With many organizations investing time, money, energy, and human resources into online multimedia presentations, we were curious: Does the presentation of editorial content in multimedia format help readers understand and remember more story information?
Recall of Information Presented in Text vs. Multimedia Format
This report is one of many from the Eyetrack III study of broadband-era news websites.
46 people were tested for one hour each in December 2003 by Eyetools Inc. in partnership with the Poynter Institute and the Estlow Center. During the test period, each test subject viewed mock news websites created for research purposes and real-world multimedia news features. Results were published in September 2004.
To put this concept to the test, we utilized two distinct story presentation styles. With the help of NYTimes.com, we edited text versions of two news stories to 3-5 minute reads. We then edited existing multimedia presentations of these stories to a 3-5 minute experience. Here are links to the presentations we used:
"Dangerous Business" story: Text Multimedia
"Al Hirschfeld" story: Text MultimediaHalf of our test participants (approximately 25 people) experienced one of the stories in text and the other in multimedia. The other half of our participants experienced the opposite formats. (They all saw a control article beforehand, as well.)
After they read or viewed a story, we gave the same recall quiz to both groups.
Special care was taken to ensure that participants had not viewed these stories before the day of the testing. We also specifically asked participants not to guess at answers, but rather to answer "I don’t know" if they were unsure.
In addition to recording their answers, we were able to observe eye movements and fixations for participants, which added a new dimension to this comprehension/recall study.
What we found:
Overall, we found a slight, marginally significant difference in how test subjects correctly recalled story information that was presented in text vs. using multimedia. When asked to recall information about names and places, participants who received information in text were more likely to answer questions correctly.
However, information about a process or procedure that was unfamiliar to them was more correctly recalled when participants received it in a multimedia graphic format.
Users who received information in text form seemed to have better recall of specific factual information.
There was no significant difference between men and women when it came to recall of information presented in text or multimedia format.
Observation: There was a slight difference in recall of story information between participants who received a text version vs. participants who received a multimedia version. Text resulted in better recall overall.
We observed that participants were, on average (for both stories in multimedia and text), 5 percent more likely to correctly answer recall questions about story information if they read a text version of the story. On average, the group that received the story information in text answered about 68 percent of the comprehension questions correctly, versus 62 percent correct answers for the participants who received the information in multimedia. The result has marginal statistical significance. While the difference between these groups is intriguing, further research is warranted to confirm this result.
While considering these observations, it is beneficial to look at the eyetracking data that accompanies it. Tracking the behavior of participants’ eyes at the time when the information in the recall test was presented provides interesting insight and perspective.
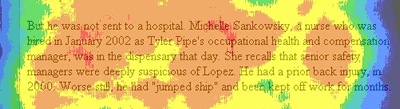
For example, in the "Dangerous Business" recall quiz, participants were asked, "Who is Michelle Sankowsky?" Sankowsky is a nurse who works for Tyler Pipe, the company that is profiled in the story. Twenty percent of the participants who saw the multimedia version answered this question correctly, while 62.5 percent of the participants who read the text version responded correctly. In this case, the observation holds up to statistical rigor, and the difference is significant.
In the text version, the answer appeared in this paragraph:
Applying the heatmap key to this paragraph reveals that between 70 and 80 percent of those who viewed the story read Sankowsky’s name and occupation. (A heatmap is an aggregate image showing overall eye activity on a webpage. Red-orange areas indicate the most eye activity, blue-black the least.)
Now, let’s compare that to the tracking data from the multimedia. At the time Sankowsky was identified, viewers were shown a photo of her face while they heard audio of her talking.. Her identification is in the text below the photo:
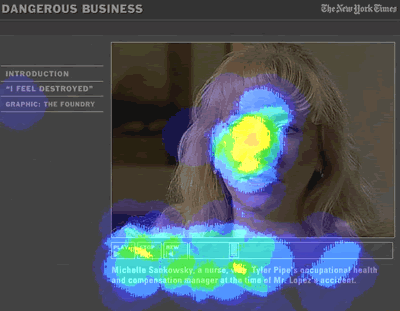
Applying the heatmap key here reveals that 70-80 percent of participants looked at Sankowsky’s face, and only about 40 percent read the part of the caption that contained Sankowsky’s name and occupation.
This is an area where further study is required before any solid conclusions can be drawn, but we do see evidence here to suggest that multiple, potentially conflicting streams of information (graphic, audio, and text) might impede some types of recall rather than help it.
Observation: When asked to recall information about names and places, participants who received information in text were more likely to answer questions correctly. Our eyetracking data indicate that participants re-read story information that could be perceived as shocking or unusual.
Using the "Dangerous Business" story as an example, we observed that correct recall of dramatic or shocking information is high. For example, part of this story is a description of worker Marcos Lopez’s on-the-job injury. Pictured below is the tracking heatmap data for that part of the story.
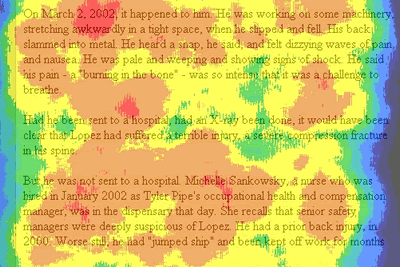
As the heatmap indicates, 60-70 percent of participants read the entire three paragraphs, with portions read by 80 percent and above. Moreover, our tracking shows that people read (and re-read) the paragraph describing what happened right after the injury (Lopez was not taken to the hospital or even to have an X-ray).
We noticed that correct recall of this information was higher for those who received the information in text. Ninety-six percent who received the information in text got the answer right. Seventy percent who received the information in multimedia answered the question correctly. The results hold up to statistical testing, demonstrating that this difference is significant.
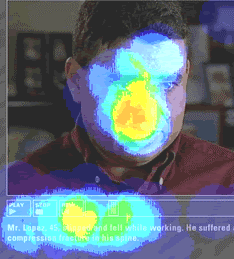
The multimedia piece presented most of this information in audio and/or text. Here is a heatmap for the multimedia frame where Lopez’s injury is described:
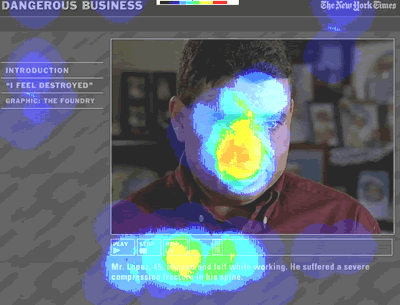
While audio of Lopez talking about the injury plays, the image of him is displayed. The text below the photo is a succinct description of what happened: "Mr. Lopez, 45, slipped and fell while working. He suffered a severe compression fracture to his spine."
Again, notice that the text below the photo is read by only about 60-70 percent of those who encounter this presentation. Just about everyone looks at Lopez’s face, though. The audio does not appear to compensate, in terms of information recall, for the fact that the participants did not read the caption.
Observation: New, unfamiliar information about processes or procedures was more correctly recalled when participants received it in a multimedia graphic format.
When asked to recall information about a process or procedure or to define vocabulary related to a new process that few participants were likely to have ever heard of before, participants who received information in multimedia graphic formats appeared to learn more effectively and were more likely to answer questions correctly.
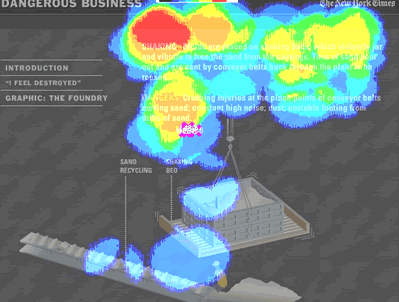
For example, part of the "Dangerous Business" story helped readers understand how iron pipes are made. We found that most comprehension questions about this process where more likely to be answered correctly by those who received this information in an animated graphic than by those who received it in text. When participants carefully reviewed a moving illustration of this process, they seemed better able to recall it. Here is how two of the questions and answers broke down.
Recall test question
Text readers who answered question correctlyMultimedia viewers who answered question correctly
What is a cupola?
Answer: A furnace that melts tons of scrap metal.
8 percent
65 percent
Statistical testing demonstrates that this difference is significant.
The data explain the process that people used to learn this new term.
When the cupola first appeared on the screen, participants read about the term in the paragraph that accompanied the graphic; they also viewed the image with nearly universal consistency. When it came time to answer the question, these participants had successfully learned the term.
The responses about how pipes are formed did not reflect as dramatic a difference.
Recall test question
Text readers who answered question correctly.
Multimedia viewers who answered question correctly.
How is molten iron formed into pipes?
Answer: It is poured into spinning cylinders.
71 percent
80 percent
The statistical data suggests that the mode of delivery — text or multimedia — did not have a significant impact on whether our participants answered this recall question correctly.
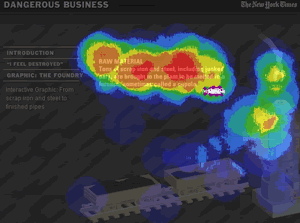
Here’s the heatmap for the portion of the multimedia presentation that presented that information:
It is important to note that, here again, there are two modes of communication at work — text and moving illustrations. Further study needs to be done to see if this behavior changes when audio is added to the mix.
Observation: Users who received information in text form seemed to have better recall of specific, factual information.
Most of the questions on our recall tests asked participants to remember specific factual information, rather than concepts. The majority of these types of questions were answered correctly by participants who received the information in text form. Here are some examples:
Recall test question
Text readers who answered question correctly
Multimedia viewers who answered question correctly
Which statement most accurately depicts what happened to Lopez after he received an X-ray?
Answer: The results of the X-ray were not divulged to him.
96 percent
70 percent
What is the average air temperature inside the Tyler pipe foundry?
Answer: 130 degrees.
88 percent
60 percent
Which group of individuals most considered it an honor to be drawn by Hirschfeld?
Answer: Stage performers.
95 percent
38 percent
Statistical testing supports that the differences in these responses are significant, and show that text was a more effective delivery system in terms of users’ recall. However, as noted in the section above, new, unfamiliar information (defining a "cupola") was better recalled when participants received it in a multimedia form.
One other question also had a statistically significant advantage for those who received the information in multimedia form:
Recall test question
Text readers who answered question correctly.
Multimedia viewers who answered question correctly.
What hours did Hirschfeld usually work?
Answer: 10 a.m. to 5 p.m.
60 percent
92 percent
Statistically, this result is significant. The presentation of the information in multimedia form had a positive effect on the accuracy of the participants’ recall.
To understand this performance disparity, we took a closer look at how the information was presented in both versions and found some interesting differences.
When we looked to the article, we saw that this information is available in one place — in a sentence at the end of a paragraph.
By contrast, the video segment entitled "Video: Work Habits" has two distinct differences:
- It has moving images of Hirschfeld at his drawing board accompanied by a personal narration from his manager about how he spends his time during a typical day.
- It dedicates about 75 percent of this one-minute clip to the topics of how and when he works. The red line drawn in the progress bar section of this clip (pictured below) indicates the segment during which this discussion plays.
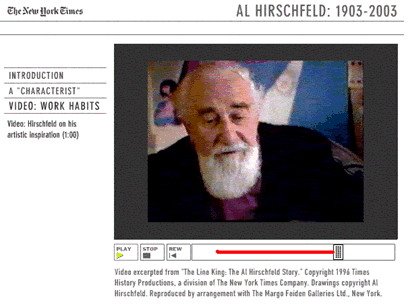
It is difficult to know whether it was the length of time dedicated to his work habits in the video or the mode of delivery (audio narration and images) that contributed to this significant recall advantage for multimedia. Again, this is an area where further study is required before any solid conclusions can be drawn. However, we do see evidence here to suggest that a 45-second audio narration with images could encourage recall more than a sentence of text.
Observation: We found no significant difference between men and women when it came to recall of information when presented in text vs. multimedia.
Contrary to our hypothesis that men might perform better with multimedia content (based on many younger males’ predilection for computer games), when we analyzed our data for gender, we saw no significant difference in men’s and women’s abilities to correctly recall story information presented in text vs. multimedia.
Gender
Correct answers when story was received in multimedia
Correct answers when story was received in text
Male
62 percent
68 percent
Female
63 percent
68 percent
Although the multimedia world of video games seems to be male dominated, we learned that women and men absorb information in similar ways when presented with news online. In future studies it would be worthwhile to look at other demographic information such as race and economic status. We also should consider user satisfaction of the experience and see how that crosses demographic lines.
Tips
- With only a marginally significant percentage of improved recall from text, it is difficult to offer a firm suggestion about the benefits or drawbacks of multimedia. However, it is important to be judicious in decisions about when to invest time and energy into multimedia projects. It also is important to remember that information recall probably is not your only goal. User satisfaction and overall understanding also are important to any good piece of journalism, and these aspects were not tested in this study.
- Because facts, names, and places seem to be recalled best when presented in text, designers may want to factor this into their choices about what projects are best suited for multimedia.
- Animated graphics seem to be an effective way to teach readers about processes and procedures or to acquaint them with new terms and concepts. Remember that clear, concise writing in the accompanying text is essential, because it is heavily read.
- The best journalists working in multimedia environments know how to make good choices about the presentation of story information. As demonstrated in this research, some information is best conveyed by the use of good, descriptive writing. Other information is better explained graphically.
Written by Laura Ruel and Steve Outing, project managers; research and tools by Colin Johnson, Greg Edwards, and Leslie Kues of Eyetools Inc. Reproduced with permission.